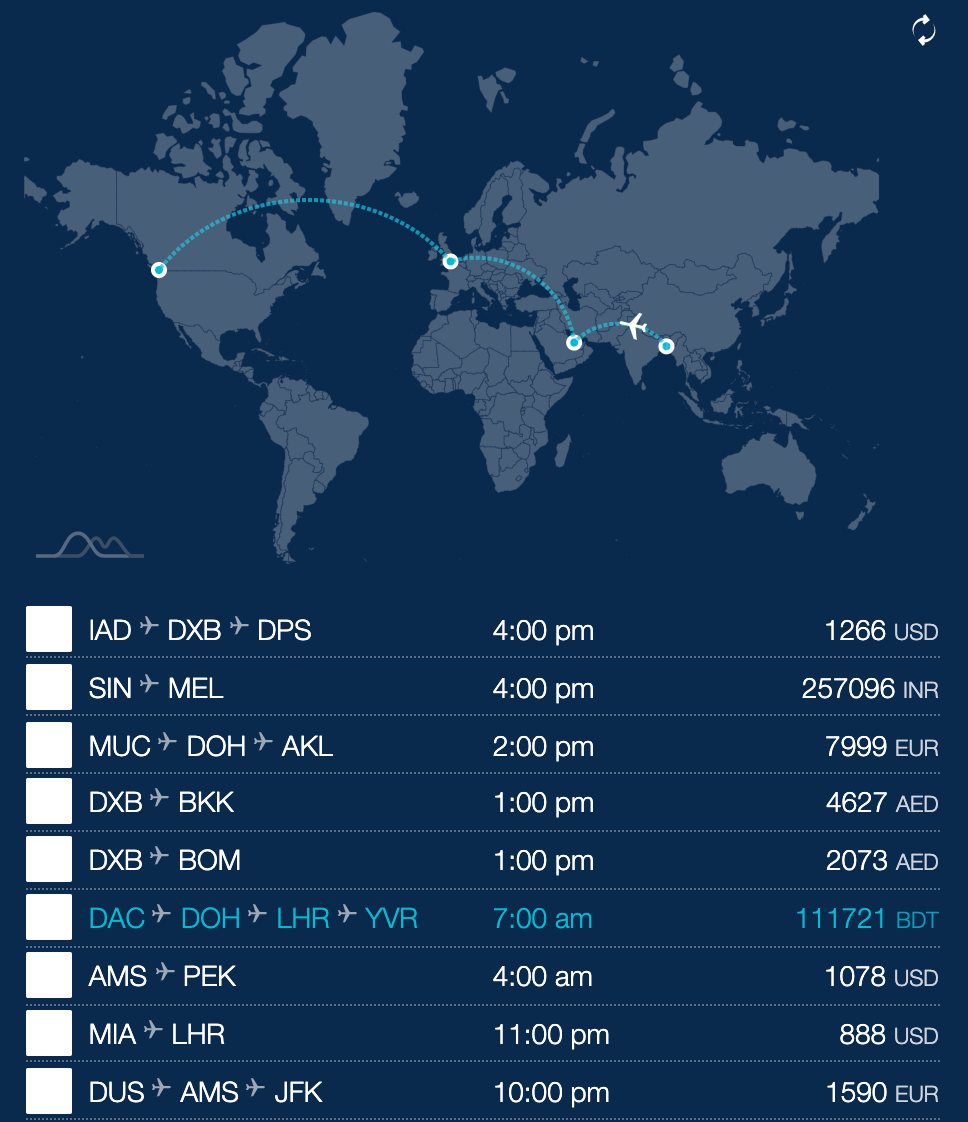
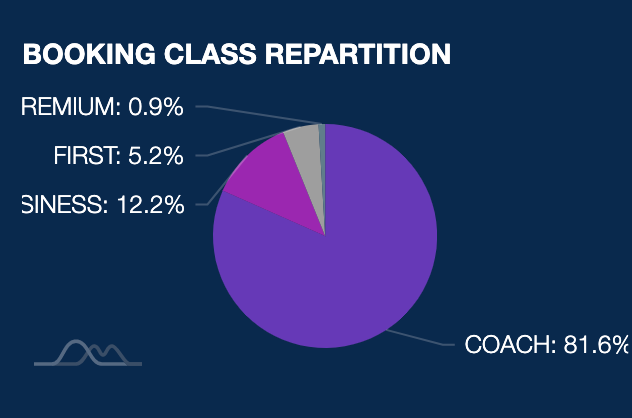
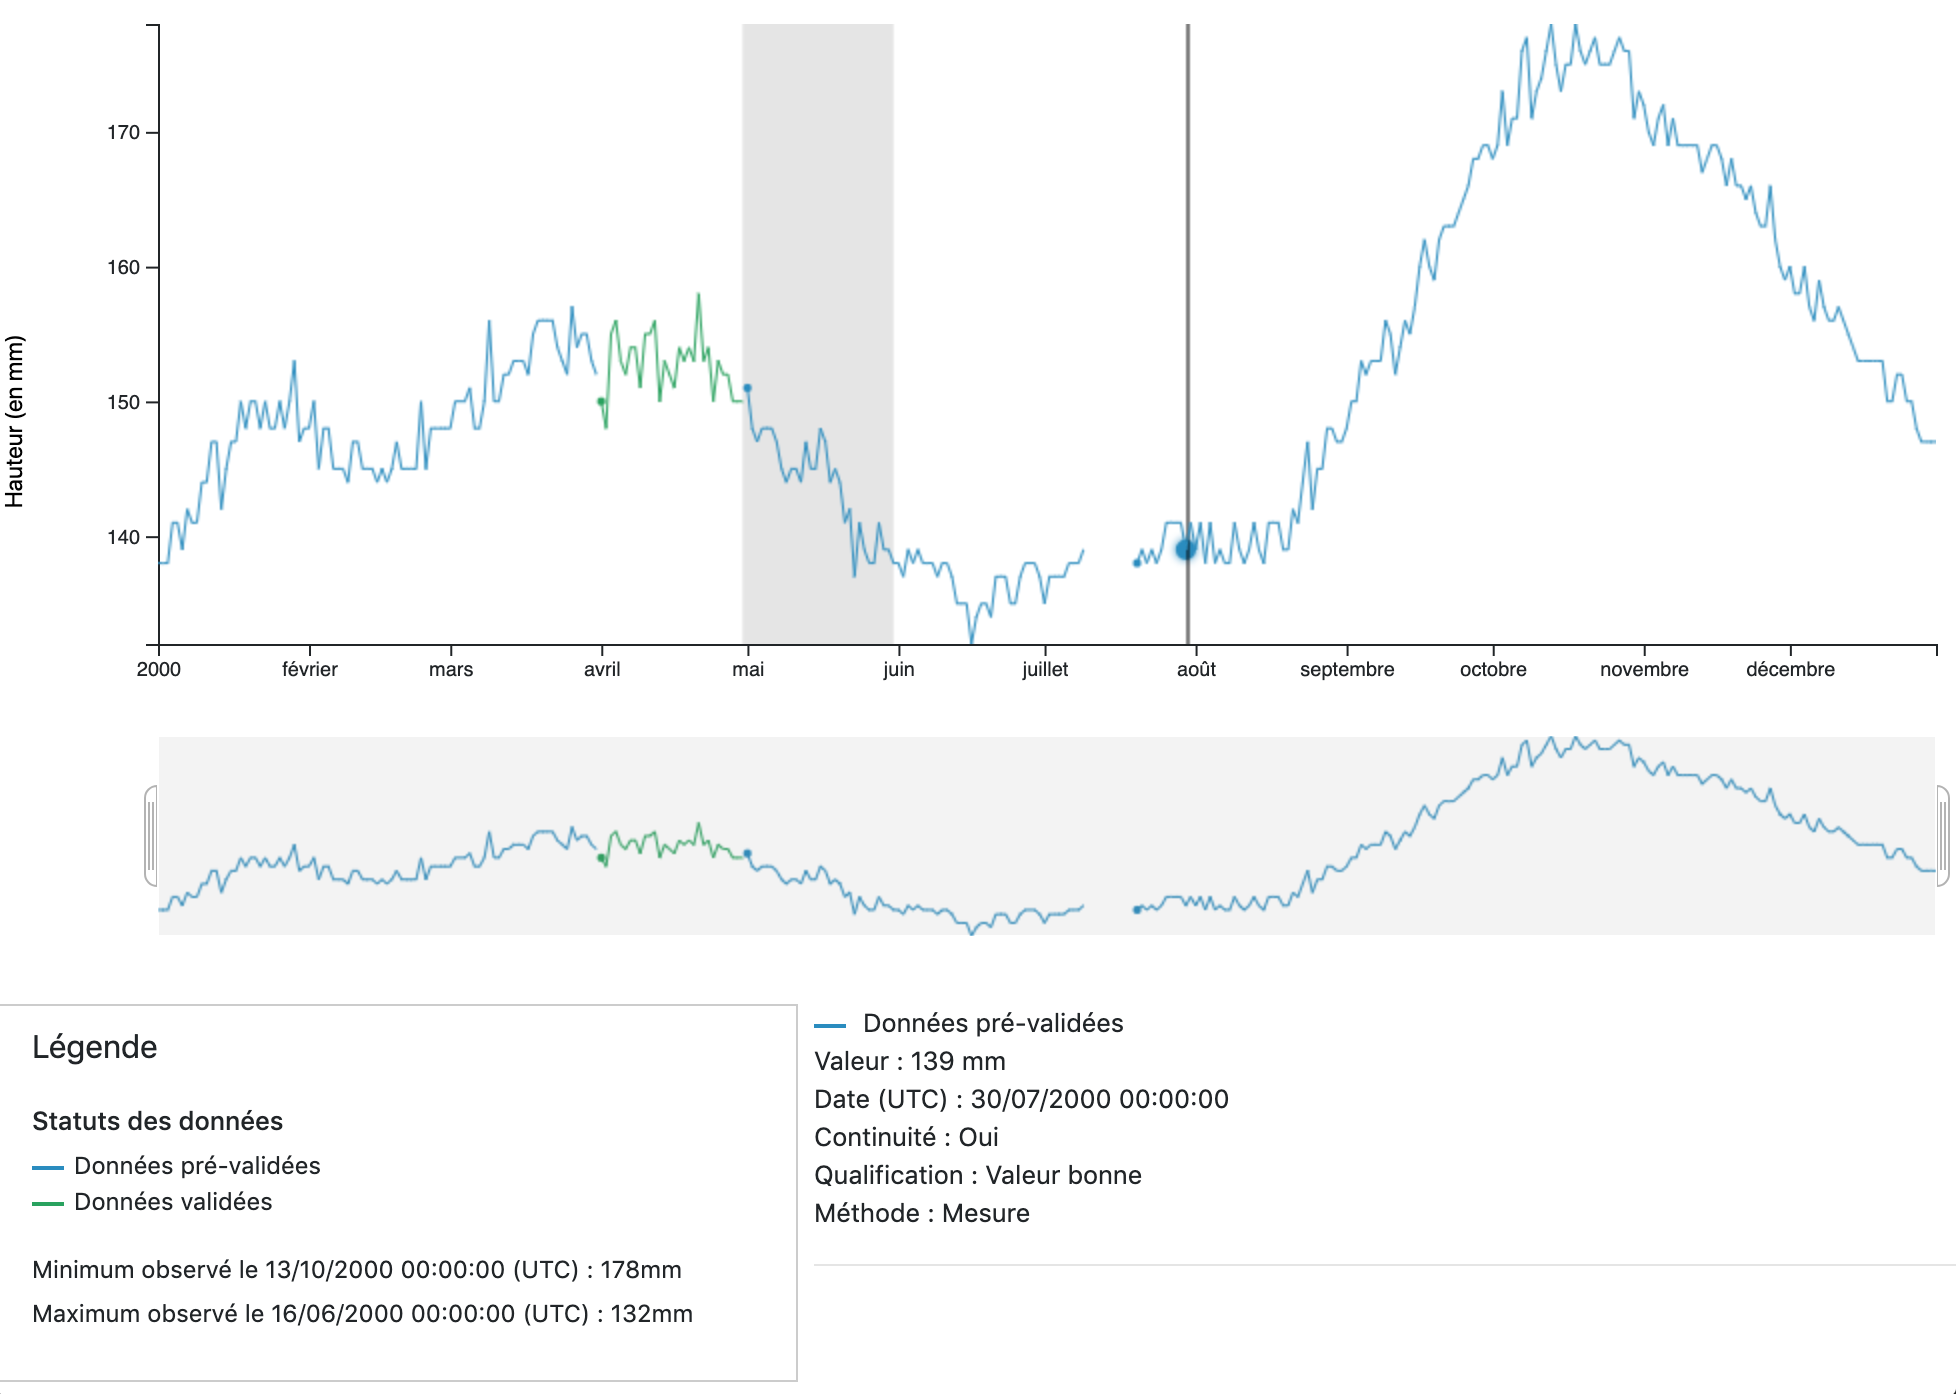
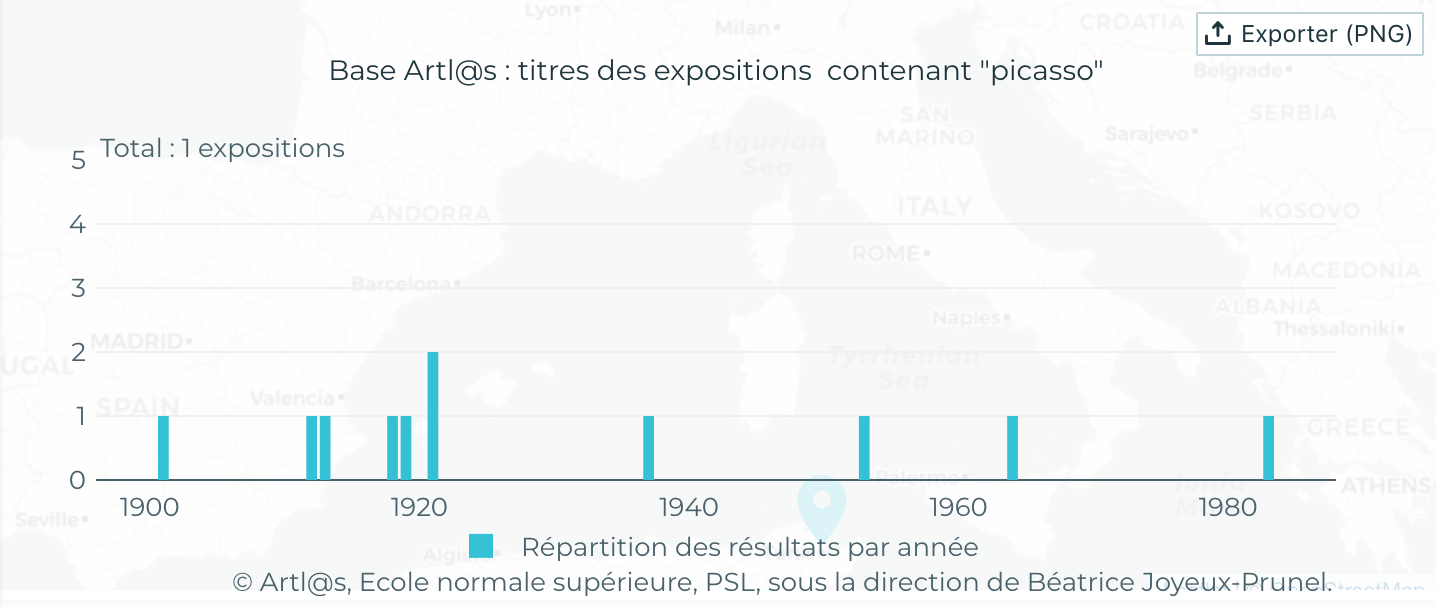
For many projects, I had to draw data visualisations indicators. Depending on clients needs and constraints, I used different libraries like PlotlyJS, AmCharts or D3.
Components built with AmChartsData visualization with D3Timeline built with D3Data visualization with Plotly